Our Work in the Field

Real Engagements. Real Problems. Real Outcomes.

The following case studies are drawn from real client engagements conducted in 2025–2026. Every problem described was diagnosed from actual data. Every solution was implemented inside the client's existing systems. Every outcome was measured.

The details of each property remain confidential at our clients' request. We believe that discretion about client information is not a limitation. It is the standard of professionalism our clients deserve, and expect.

We have separated these into three distinct stories because these are three distinct problems. They were selected from three different clients (all 5-star Turkish hotels) because these problems exist independently at hotels across Turkey and the wider region. Read whichever story feels most familiar. That familiarity is the starting point for a conversation.

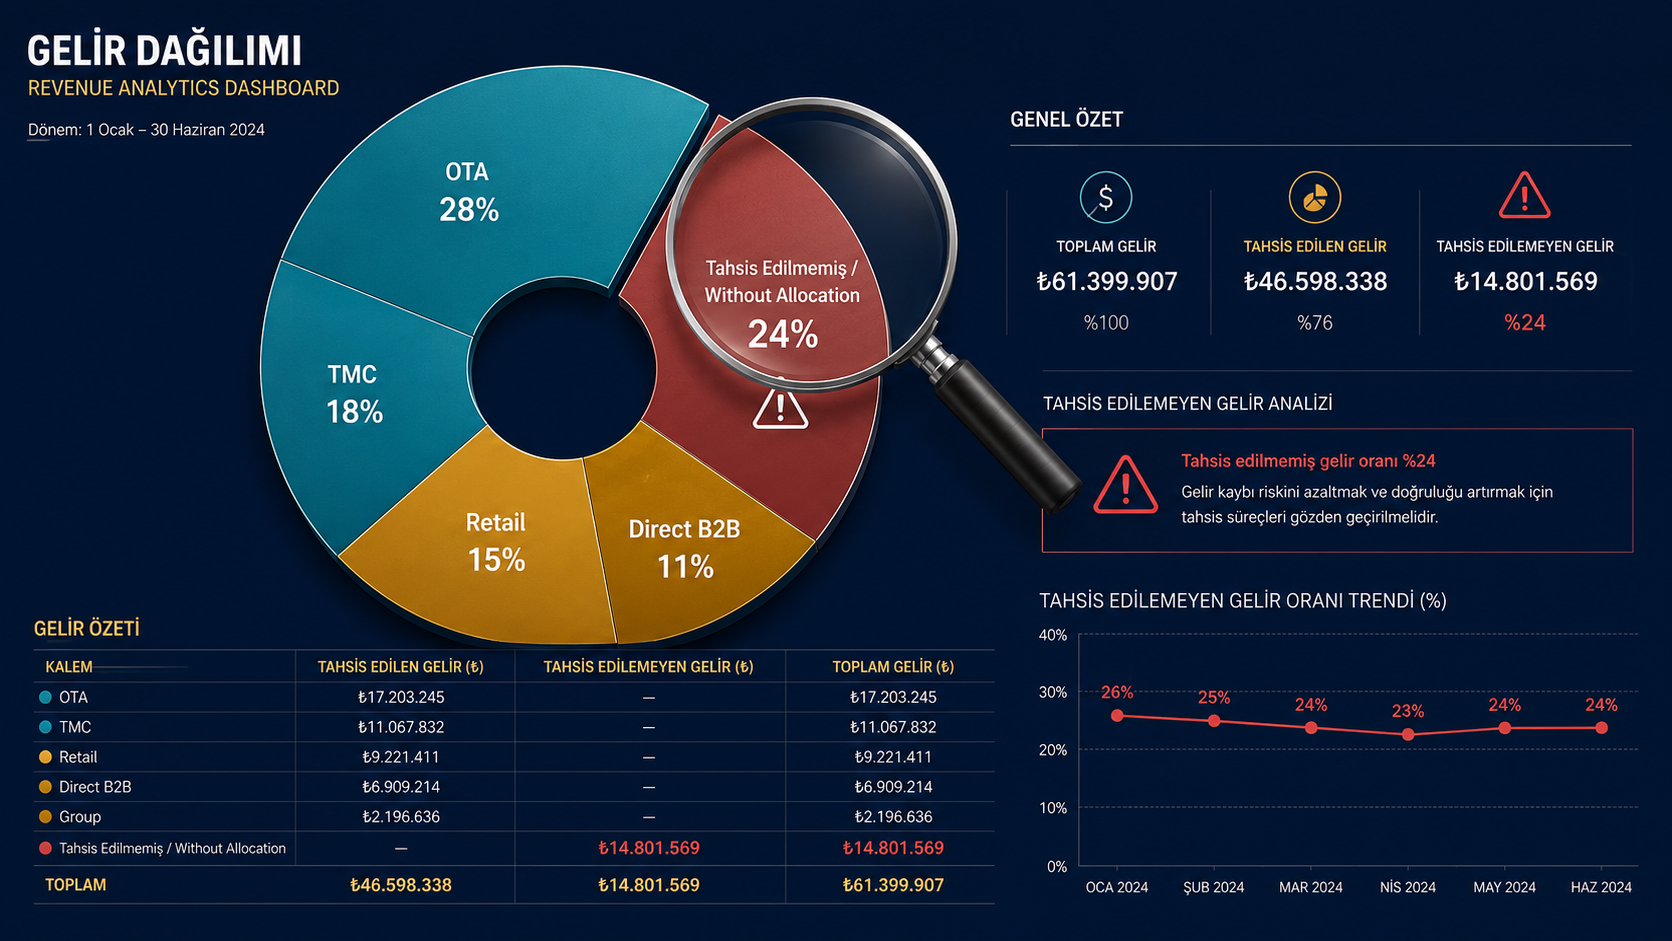
24% of revenue with no commercial identity: unallocated revenue pie chart

Case Study 01 · Revenue & Data Hygiene

"We Had No Idea 24% of Our Revenue Was Invisible."

How a structured diagnostic revealed a systemic data gap, and fixed it in a single day.

The Situation

When we began working with one of our hotel clients (a 5-star branded property in Turkey), their commercial data looked broadly acceptable on the surface. ADR was climbing year on year. Occupancy was holding steady. The revenue manager's daily reports were being produced and reviewed.

But when we ran a structured analysis of their property management system's market segment statistics across three years of data, something appeared that nobody on the team had formally named before.

Between 17% and 24% of total recorded revenue appeared under a single line called "Without Allocation", carrying just 1 or 2 roomnights but tens of millions of Turkish Lira in value. It had no channel. No guest segment. No commercial origin.

This was not fraud. It was not a system malfunction. It was something quieter and in some ways more damaging: a workflow gap that had been silently distorting every commercial decision the property made for years, without anyone realising it was there.

The Diagnosis

We applied our Revenue Visibility Audit™, a structured three-phase process we have developed to find exactly this kind of problem. Phase 1 is discovery: understand the system, find the source. Phase 2 is root cause: determine whether it is a system limitation or a process gap. Phase 3 is fix and verify: implement the solution and confirm the outcome with data.

Within one structured meeting with the Finance and Accounting team (using a prepared question framework), the source was identified: Banquet and F&B revenue was being posted to Pay Master (PM) accounts manually by the food and beverage team. When these PM accounts were created, no market segment code was being assigned. With no segment code, the system had nowhere to file the revenue, so it fell into the default 'Without Allocation' bucket every single time.

The Solution

17–24%

Revenue with no commercial identity, before correction

1 Day

Time from diagnosis to fix implementation

<10%

Target: Without Allocation by end of July 2026

TRY 0

Cost of the fix

The Outcome

We also produced a custom commercial dashboard for this property, pre-loaded with their own 2026 budget data by channel, their full 2025 last-year comparison, and their YTD actuals, that now flags the Without Allocation percentage automatically each month, with a visual warning if it exceeds 20%. The GM opens one file, once a month, and sees the full commercial picture.

This problem exists in almost every hotel PMS report we have reviewed. The name changes ('No Segment', 'Unallocated', 'Other'), but the pattern is the same: revenue that has no commercial identity, making it impossible to manage what you cannot measure. If your market segment report has a line like this, we know where to look.
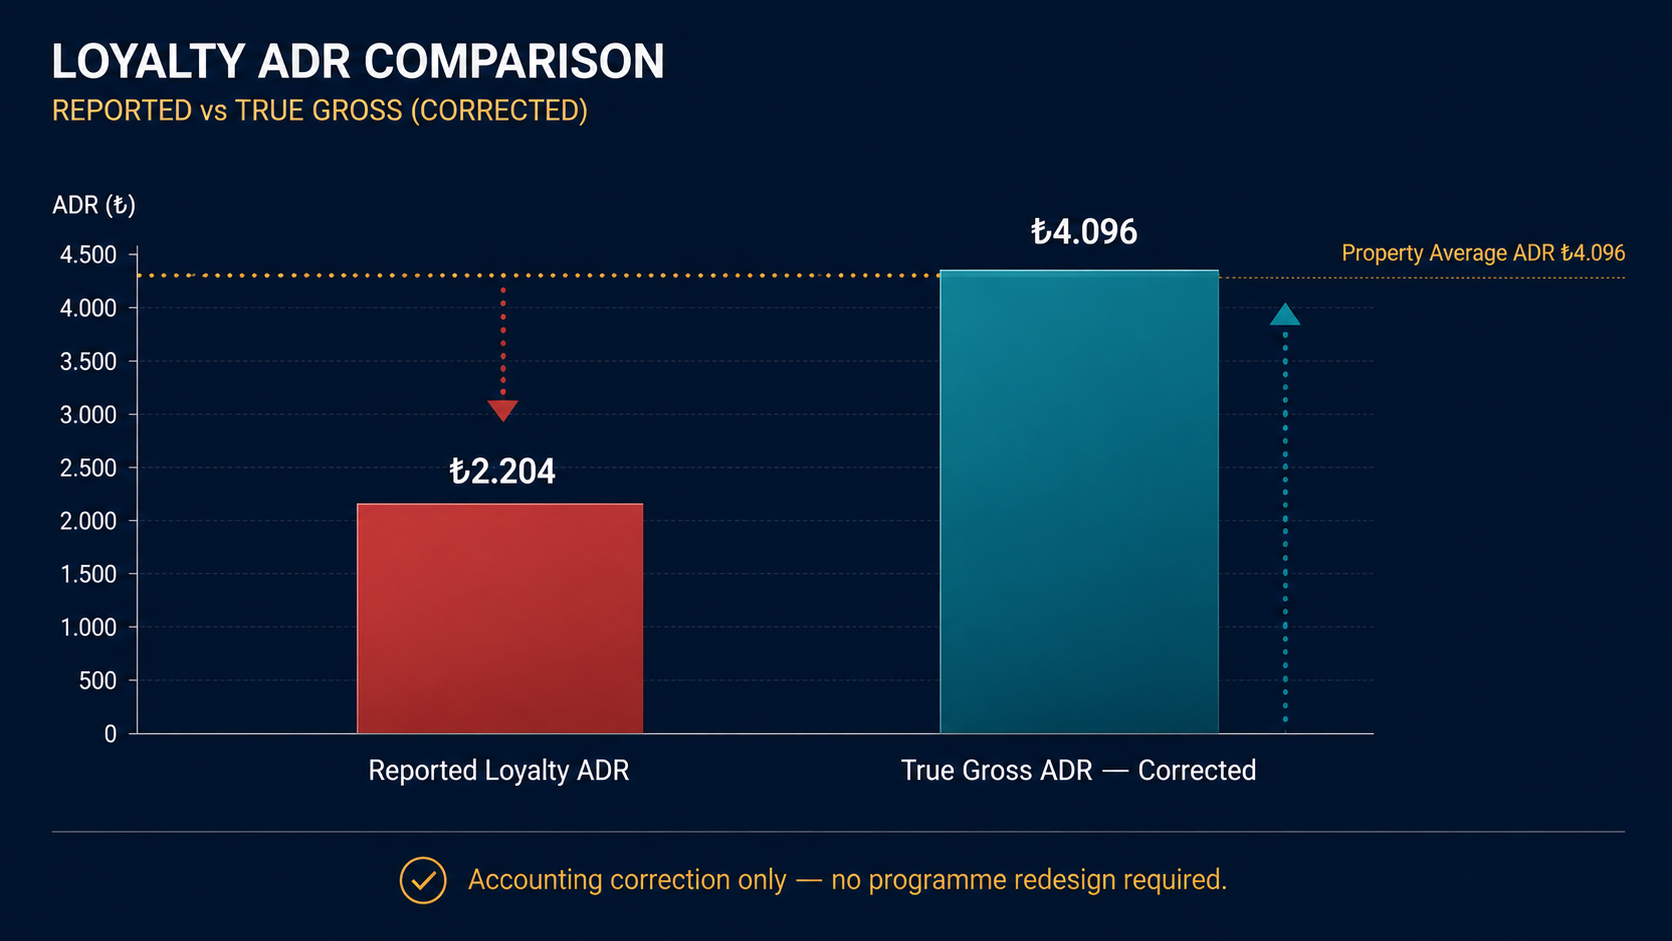
Reported loyalty ADR vs true gross ADR bar chart comparison

Case Study 02 · Loyalty Programme & Accounting

"Our Loyalty Channel Looked Like Our Worst Performer. It Wasn't."

How a misunderstood accounting mechanism was making a well-run loyalty programme look commercially damaging.

The Situation

The hotel's market segment statistic report showed their Loyalty Programme carrying an ADR index of just 54% of the property average. In revenue management terms, that number is alarming. A channel running at 54% of your average rate looks like it is dragging your entire performance down: discounted guests, commercial leakage, a programme that is costing more than it is contributing.

The instinct when you see a number like that is to look at the programme itself: are guests being given too deep a discount? Is the redemption policy too generous? Should the programme be redesigned?

We looked elsewhere first.

The Diagnosis

Wyndham Rewards, like every major franchise loyalty programme including Marriott Bonvoy, Hilton Honors, and IHG Rewards, operates on a reimbursement model. When a guest redeems points for a free or discounted night:

A room that should have shown a TRY 4,000 ADR was appearing in the Market Segment Statistic as TRY 1,500–2,200. Not because the guest paid less. Because the fee and the redemption discount were subtracted before the number reached the report, and the deduction was invisible.

The loyalty channel was not underperforming. The accounting was misrepresenting it.

The Solution

This is an accounting recording correction: not a programme redesign, and not a renegotiation with Wyndham. It works entirely within existing franchise policy.

We delivered this as a bilingual (English/Turkish) accounting advisory directly to the Finance team, with a worked journal entry example, a suggested new GL account code, and a clear statement of what the correction does and does not change.

54%

Reported Loyalty ADR index, before correction

4.25%

Loyalty fee, lowest tier from strong enrollment

669+572

Enrollments Q1 & Q2 2026 (743% & 476% of target)

£0

Cost of the fix

This accounting gap exists across every major franchise loyalty programme. If your loyalty channel appears to be your weakest segment by ADR, there is a reasonable probability the report is showing you Wyndham's (or Marriott's, or Hilton's) net reimbursement rather than your true rate. The programme may be working exactly as intended. You may just not be able to see it clearly yet.

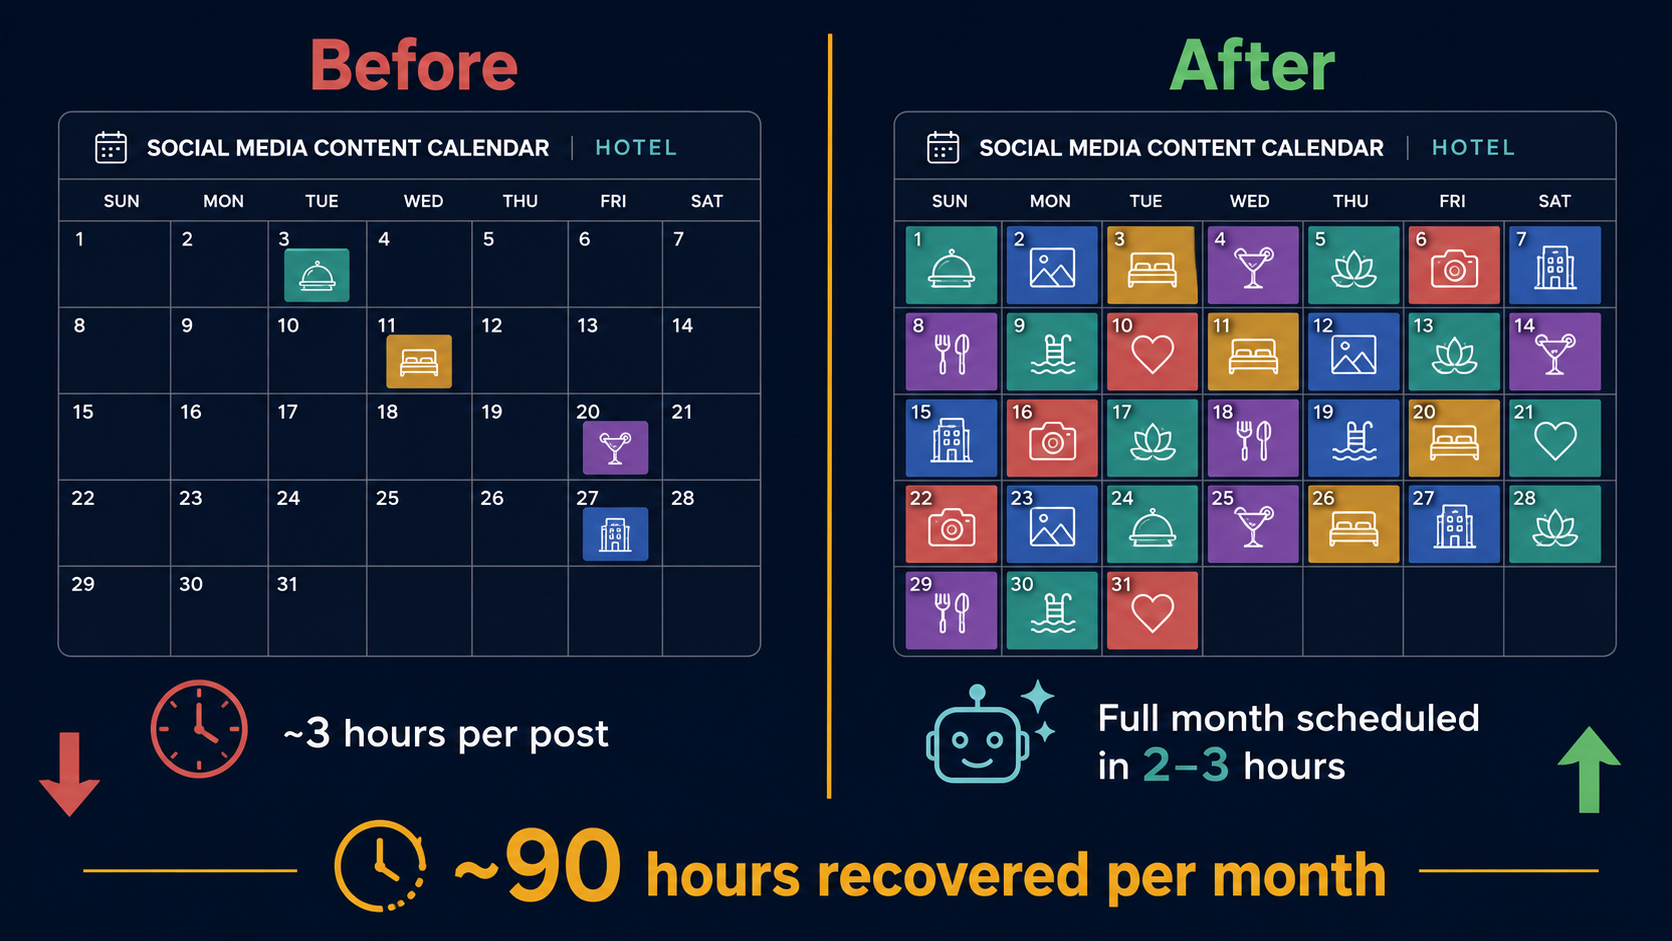
Before and after social media content calendar comparison

Case Study 03 · AI Adoption & Marketing Productivity

"17 Posts in 6 Months. Then We Trained Them."

How one afternoon of structured AI training turned a reactive, inconsistent social media presence into a daily, automated content system, and freed 90 hours a month for higher-value work.

The Situation

The hotel's marketing team was responsible for social media across Facebook and Instagram. By the 23rd of June 2026, nearly halfway through the year, they had published 6 posts on Facebook and 11 on Instagram.

This was not from lack of effort or interest. When we sat with the team and asked why, the answer was immediate and honest:

"We only have three room types. We have some live music events and occasionally a food offer. We don't feel like we have enough to post about, so we wait for something to happen, then we post about that."

On top of the content problem, there was a production problem. Creating a single image manually in Canva took hours. By the time a post was designed, captioned, and uploaded (for a single piece of content), a significant portion of a working day was gone.

The result: a social media presence that posted reactively, inconsistently, and infrequently, which in the algorithm-driven world of Meta platforms means low reach, low engagement, and an online presence that does not reflect the quality of the physical property.

What We Did

We delivered a structured training session in prompt engineering and AI-powered content creation, built specifically around the hotel's context, not a generic technology course.

Session structure:

17

Total posts across both platforms, first 6 months

Daily

Publishing frequency after training

2–3 hrs

Time to create & schedule a full month of content

~90 hrs

Monthly working time redirected to higher-value work

The Outcome

In the first session after training, the marketing team created and scheduled a full month of content (across Facebook and Instagram) in approximately 2 to 3 hours. Posts now publish automatically, every single day, without any further daily effort.

The content itself is stronger: more varied, more consistent in tone, better matched to what performs on each platform. The team no longer waits for an event to happen before they have something to say.

The Bigger Point

The 90 hours is not the real story. The real story is what those hours are now available for.

A hotel marketing person spending 3 hours a day on content production is a hotel marketing person who is not building relationships with past guests, not responding to reviews, not running lead generation campaigns, not supporting the sales team with direct booking incentives.

AI did not replace the marketing person. It gave them back time to do the work that actually drives revenue, work a scheduling algorithm cannot do for them.

This pattern is present at almost every hotel marketing team we have encountered that has not yet integrated AI into their workflow. The content was always there: the rooms, the food, the location, the stories. What was missing was a system for producing it consistently. We teach that system. And we teach it in the context of your property, your brand, and your team — not as a generic technology course.